OFRI photo galleries
The Oregon Forest Resources Institute is proud to present select images, infographics and tables related to Oregon’s forests. These graphics come from OFRI’s photo library, or from recent special reports and publications created by OFRI. Both low- and high-resolution downloads are available within each image window. Please credit the Oregon Forest Resources Institute when using these resources. Select a specific gallery using the pulldown selector below.
For more information about usage and availability of OFRI’s photo gallery, please contact Jordan Benner, Director of Communications 503-329-1441 or benner@ofri.org.
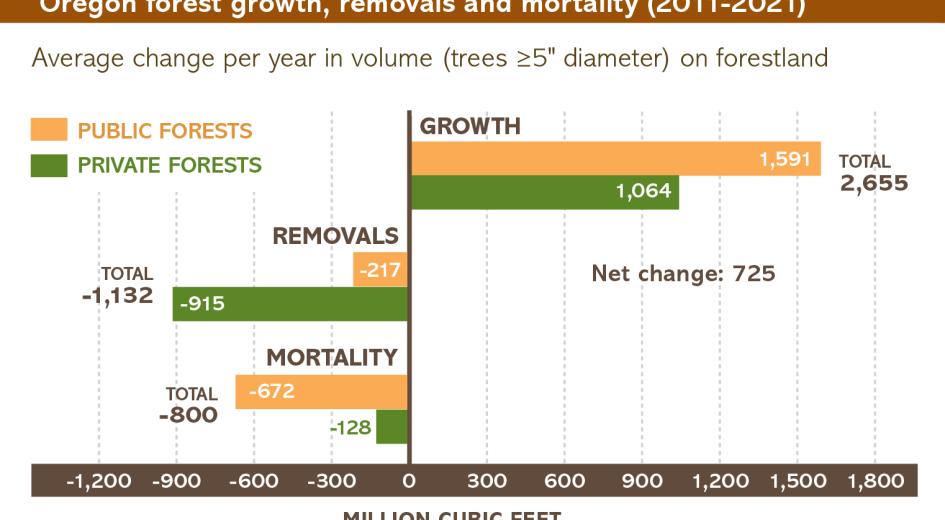
Forest growth, removal and mortality
When comparing the growth in Oregon's forests to the removal and death of trees in the forest, Oregon continues to increase the volume of wood year over year.
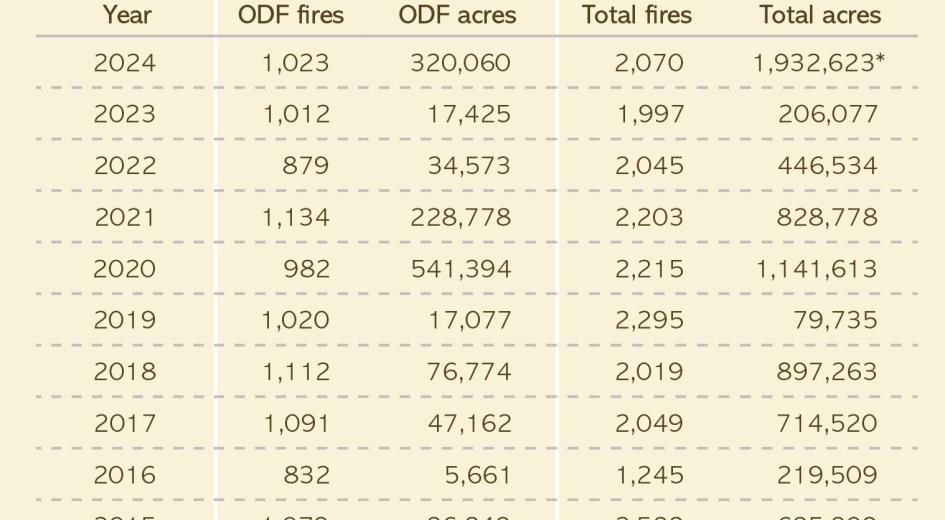
Wildland fire acres burned
The total acres burned by wildfires in Oregon has increased dramatically in recent years.
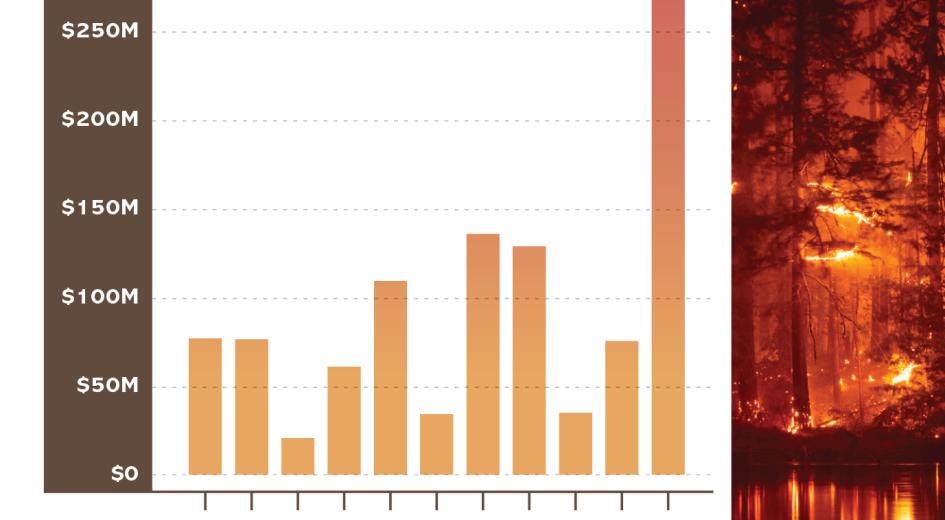
Cost of fighting fires
The cost of fighting fires in Oregon continue to grow, with significant increases in recent years.
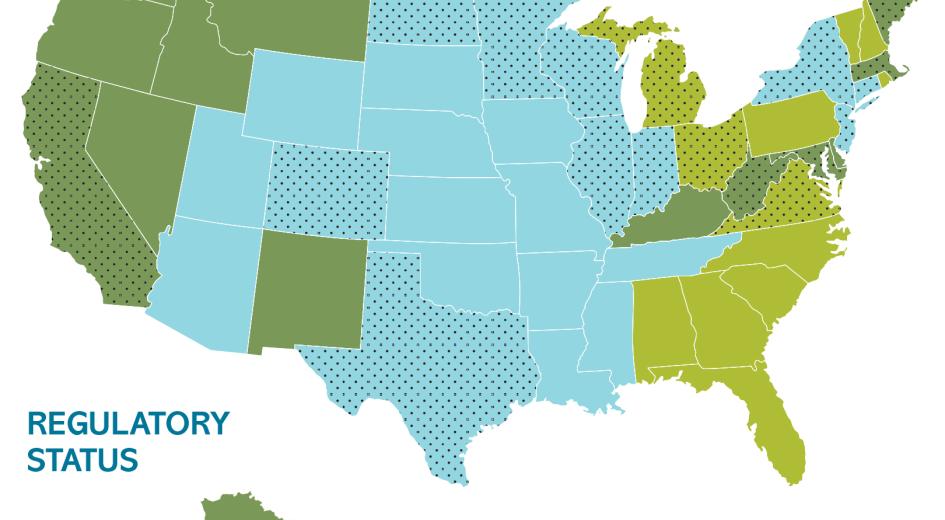
Regulations map
Different states have different regulatory systems. How does Oregon compare to other state regulations?
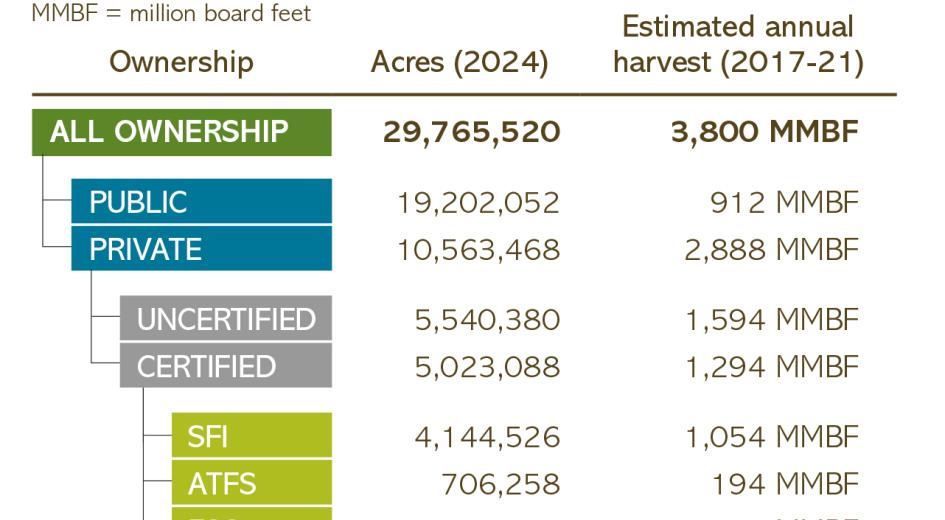
Certified and uncertified forests
How many of Oregon's forested acres are certified under either SFI, FSC or American Tree Farm?
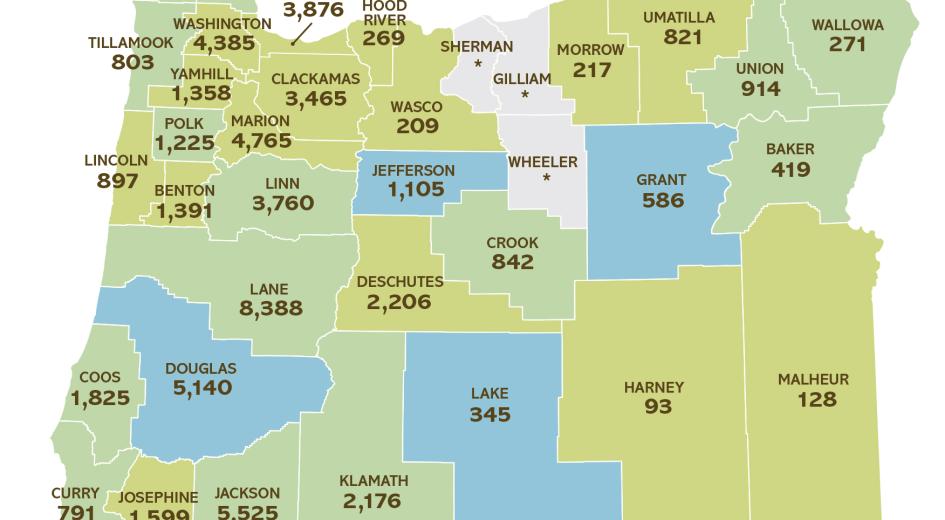
Forest sector jobs by county
How are forest sector jobs distributed throughout the state of Oregon? Let's look at each county.
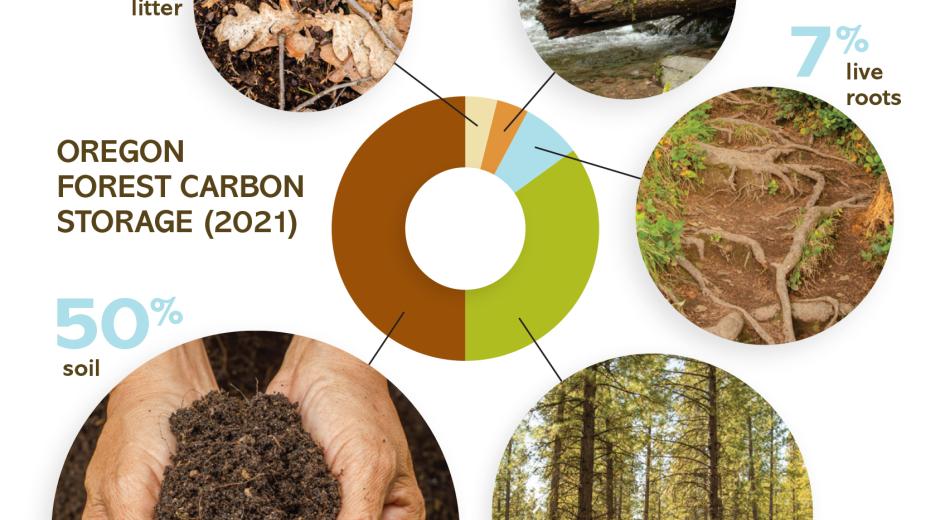
Carbon distribution
Where is carbon distributed in the forest? Soils, living trees, roots and dead wood all hold a portion.
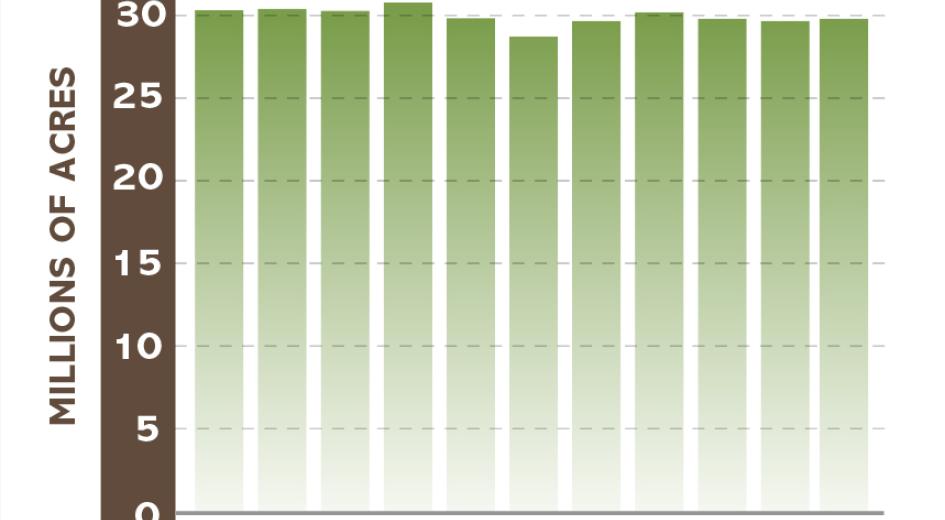
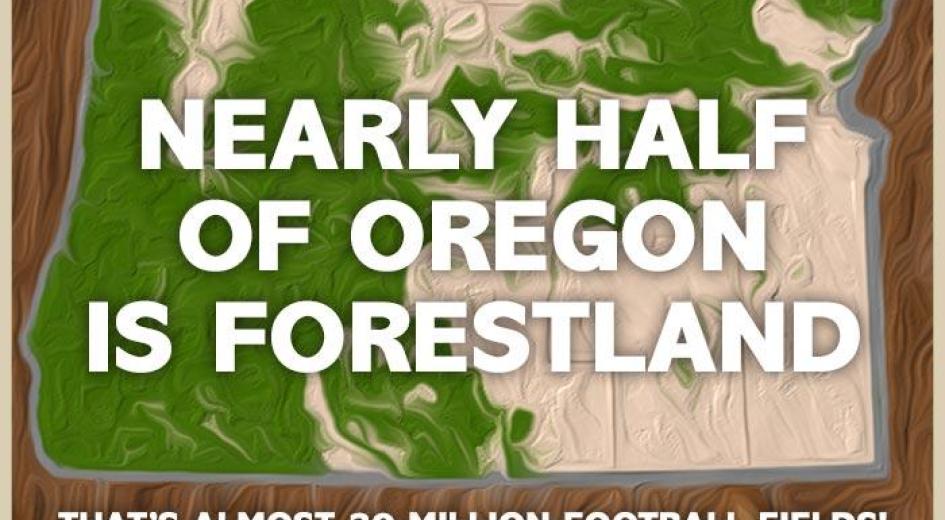
Oregon Forestland Acreage
Oregon's total forest acreage remains fairly consistent over many decades.
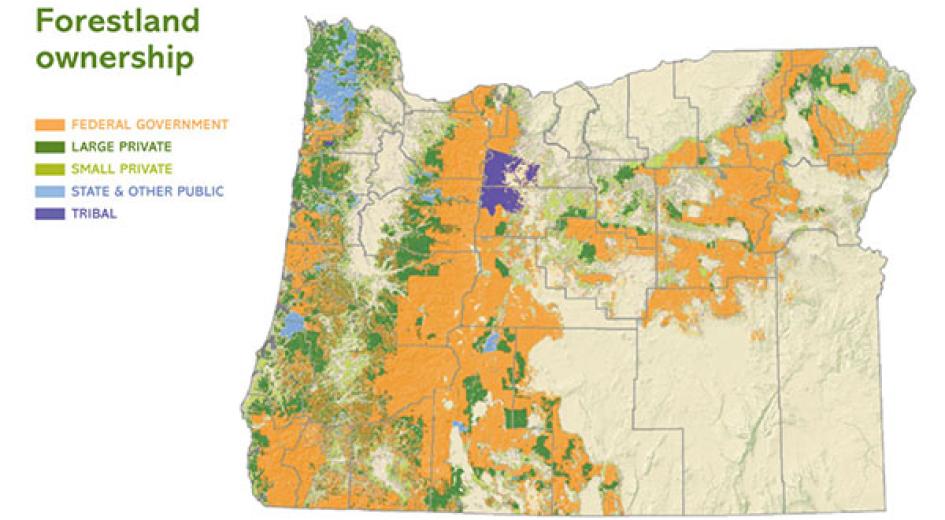
Ownership map
Oregon’s forests are owned and managed by the federal government, state government, county and municipal governments, private timber companies, tribes and small woodland owners.