Meet the standing dead – Oregon’s “zombie trees”
October 30, 2017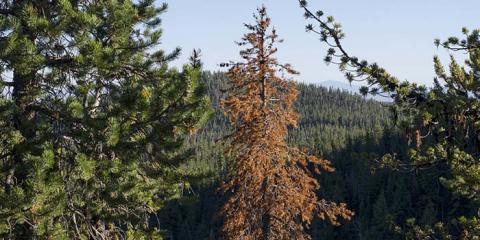
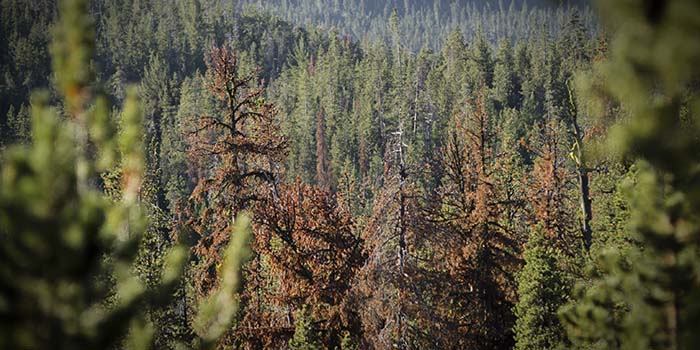
Halloween is a great time to tell scary stories. I have one to tell you, about millions upon millions of gray ghosts blackened by fire, ravaged by insects and disease, or dead from lack of water. These are Oregon’s “zombie trees.”
According to an analysis commissioned by OFRI, more than 350 million individual trees are standing dead in the 14 million acres of national forestland in Oregon. The bad news? The number of dead trees is expected to increase. This would provide more fuel for catastrophic wildfires such as last summer’s Eagle Creek and Chetco Bar fires that blanketed the Portland metro area and southern Oregon with unhealthy levels of smoke.
The story I’m about to tell you is about the frightening number of dead trees in our national forests. It is based on data from the U.S. Forest Service’s Forest Inventory and Analysis program that was collected in 2010 and 2013 across all forestland in Oregon.
This story could have a happy ending, but it may not. To put it into context, let’s start by discussing how much forestland in Oregon is owned by the Forest Service compared to other ownership classes.
Forest ownership
About half of Oregon is forested, totaling nearly 30 million acres, giving rise to Oregon’s reputation as a green state. Forest ownership is dominated by the federal government, which manages about 60 percent of all forestland in the state. The National Forest System (NFS) is the largest class of forestland, with 48 percent of the total. Bureau of Land Management (BLM) and other federal lands comprise 12 percent. Private and Native American ownership account for 36 percent, with state and local government ownership at 4 percent.
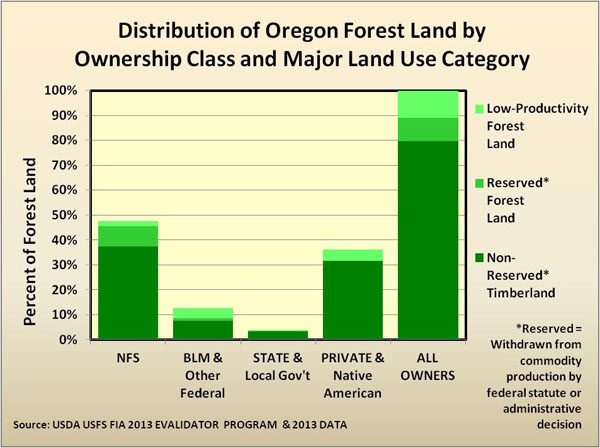
The chart above shows the breakdown of the forestland into various ownership classes.
Forestland is classified as land having at least 10 percent cover of trees. Timberland refers to forestland productive enough to be economically managed for timber production and not legislatively or administratively reserved. Reserved land is withdrawn from timber harvest.
Most Oregon forestland is classified as timberland. Most of the low-productivity and reserved forestland is federally owned. As we shall see, not all forestland is created equal – ownership matters.
Number of zombie trees by ownership class
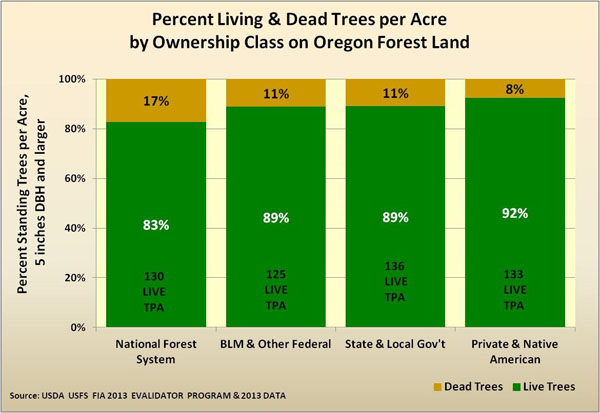
The scary part of our story starts when we compare living and dead trees per acre by ownership class. The chart below shows that National Forest System lands have 17 percent dead or zombie trees, compared to 11 percent for other public lands and 8 percent for private and Native American-owned lands. The NFS having twice as many zombie trees per acre as private lands may not seem that bad, but when you consider that there is a lot more National Forest land than any other class, it becomes quite terrifying, as we shall see.
Harvest trends
In addition to different ratios of living to dead trees in their forests, the ownership classes of Oregon forests also vary greatly in the amount of timber harvest. The chart below shows annual Oregon timber harvest by ownership class from 1980 to 2015, using data collected by the Oregon Department of Forestry.
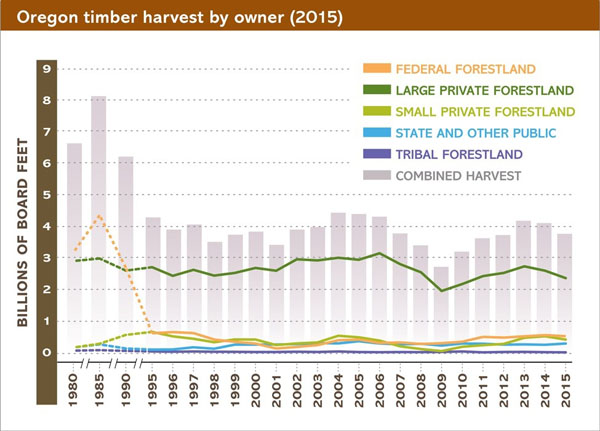
In 1985, annual timber harvest in Oregon was over 8 billion board feet, with more than half coming from federal forests. After the listing of the northern spotted owl as a threatened species under the Endangered Species Act and the subsequent Northwest Forest Plan, total Oregon timber harvest has dropped to about 4 billion board feet, with only about 15 percent coming from federal lands. The federal forests that represent about 60 percent of Oregon forestland now account for only about 15 percent of the state’s timber harvest. From the 1980s to present, private-land timber harvest has held fairly stable at about 3 billion board feet per year. Private and Native American forests, which represent 36 percent of Oregon’s forests, account for 76 percent of the timber harvest.
One simple conclusion that can be reached at this point is that forests that are more actively managed based on the number of timber harvests have fewer dead trees.
National Forest System trees per acre
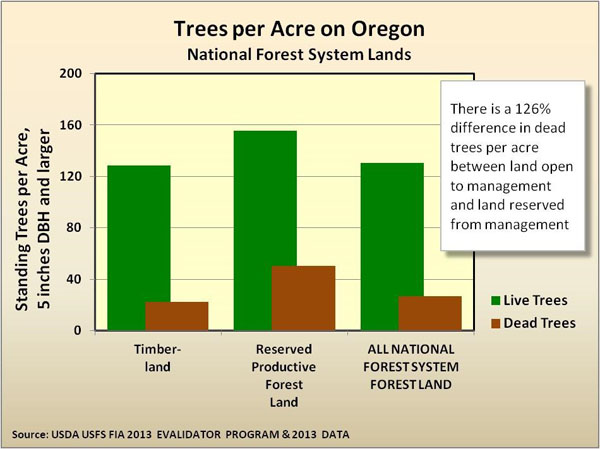
The link between active management and tree mortality can be further examined by comparing zombie trees on NFS timberland to those on NFS reserved lands, as shown in the following chart. There is a 126 percent difference in dead trees per acre between NFS land open for management and land reserved from management.
National Forest System dead inventory
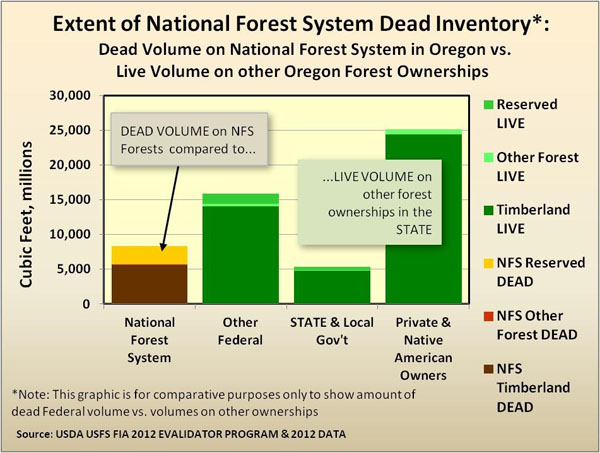
Remember when we started this story and talked about dead trees per acre? You may have thought that 17 percent zombie trees is not that different than 11 percent or 8 percent dead trees. The next chart may convince you otherwise.
This chart compares the total dead-tree volume on NFS lands to the live volume on other ownerships. The standing-dead volume on NFS lands is about half the live volume on all other federal lands. It is about 50 percent more than the live volume on all state and local forestlands, and it is nearly one-third of the total live volume on private and Native American forestlands. This is obviously more important than the difference in a few percentage points of zombie trees.
Annual growth vs. annual harvest, by ownership class
Another way to think about the level of active management is to compare annual growth with annual timber harvest. Net annual growth is the total or gross growth minus mortality. It is obvious to most folks that forests can only be sustained in the long term if annual timber harvest is less than or equal to net annual growth. If harvest is greater than growth over time, the standing forest volume will be diminished. This is typically called overcutting.
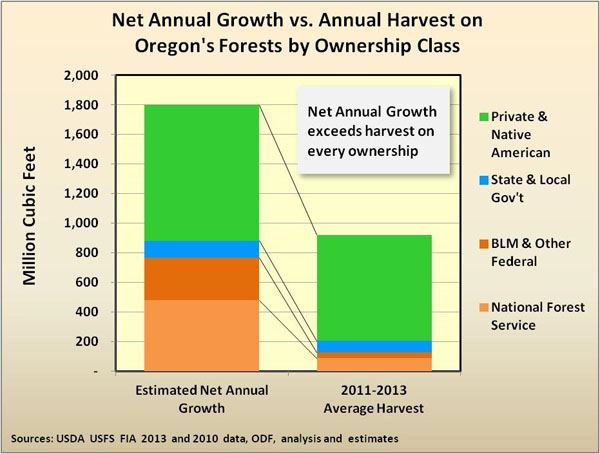
The left bar of the chart below shows net annual growth for various classes of timber ownership. The right bar shows average timber harvest for 2011 to 2013 for the same ownership classes. For every ownership, net annual growth exceeds harvest. However, on federal forestlands managed by the U.S. Forest Service and the Bureau of Land Management, timber harvest is only about 8 percent of growth.
Annual mortality vs. annual harvest
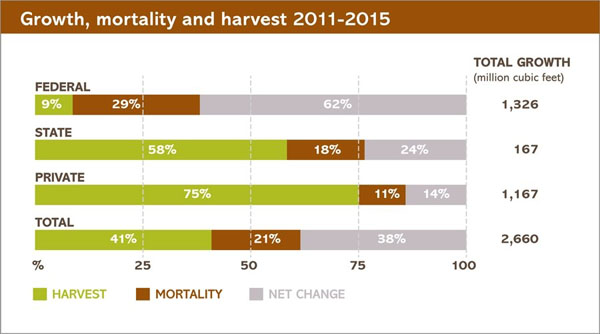
It is ironic that there appears to be an inverse relationship between annual mortality and annual timber harvest among Oregon’s forest ownership classes. Private and Native American forestlands, which have the highest timber harvest rate at 75 percent of total growth, have only 11 percent mortality. Federal forestlands have a timber harvest rate of about 9 percent of total growth, but have a mortality rate of about 29 percent.
Actively managed forests have far fewer zombie trees than forests that are less actively managed. Forests that are unmanaged quickly become overcrowded as trees grow and new trees seed in. Overcrowded forests have more dead trees and an increased volume of mortality. These dead trees also fuel any wildfires that occur. Overcrowded forests burn uncharacteristically hotter and have increased tree mortality as compared to managed forests.
Federal mortality vs. harvest
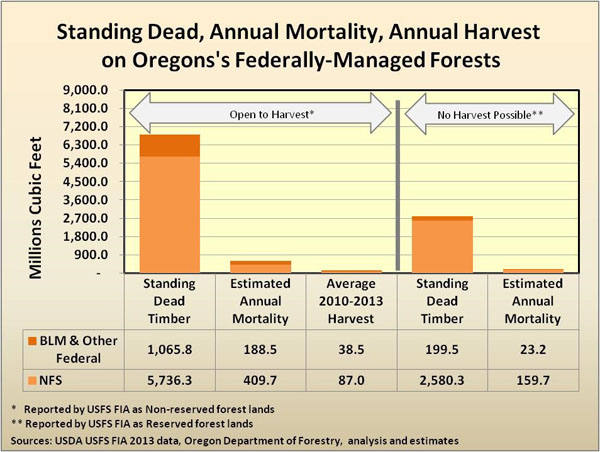
In discussing the difference in dead trees per acre on NFS reserved forestlands compared to timberlands, it may have appeared that we can do little to solve the zombie tree problem because it is mainly on reserved lands, which can’t be actively managed because they are set aside for non-timber purposes. The chart below shows that this is not the case.
This chart shows standing dead, annual mortality and annual harvest on federal lands and compares reserved to non-reserved forestlands. While dead trees per acre are much higher on reserved forestlands, the acreage of non-reserved is much larger. More than 70 percent of the standing dead timber on federal lands is on non-reserved lands open to harvest.
Conclusion: How to combat zombie trees
It’s fun to use the zombie image to discuss dead trees and mortality on National Forests. But this is a serious problem. There is an alarmingly high amount of mortality on National Forests that have low levels of timber harvest. I believe these are related issues, and the charts presented support this. Forests that have higher levels of timber harvest have lower levels of mortality.
The cure for zombie trees is active forest management. Forest policy does not always allow active management on federal lands. However, in the name of forest health, we should pursue active management strategies whenever and wherever possible.
We can combat the zombie tree apocalypse – with active forest management.
For the forest,
Mike Cloughesy
Director of Forestry